
Dashboards for Cloud Infrastructure
Part of the Cloud Computing Roadmap
In short
During an incident, nobody wants to write queries from scratch. A good dashboard answers "is it us, and where?" in ten seconds flat.
Building a focused, recurring view of key infrastructure health metrics — CPU, memory, error rates, latency — that a team can check at a glance without digging through raw logs.
Think of it like this
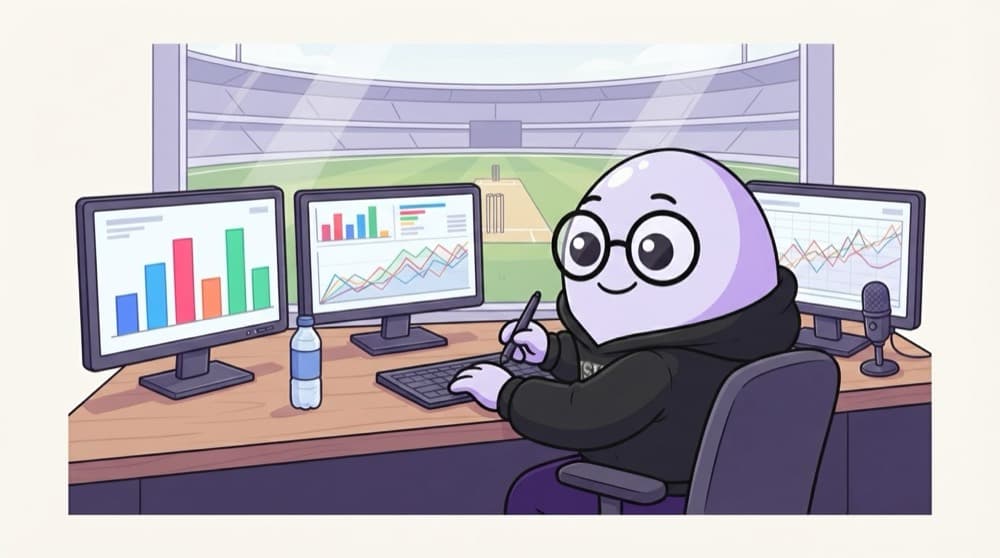
The commentary box screens
Commentators don't read the full scorebook. Their screens show run rate, wickets, required rate and the wagon wheel, chosen to tell the story at a glance. A cloud dashboard picks the few numbers that tell your system's story.
Watch it happen
Laying out one service's dashboard
1/5Top row first. These four are the "golden signals": traffic, errors, latency, saturation.
The big ideas
What you need to know
One per service
Each service gets a dashboard its team owns, plus one overview for the whole system.
Percentiles, not averages
Averages hide slow users. p95 and p99 latency show what the unlucky ones feel.
Same time window
All panels share one time range so you can line up a spike in errors with a spike in DB load.
Dashboards as code
Define them in Terraform or JSON so they're reviewed, versioned and rebuilt easily.
See it in code
A tiny example
1fields @timestamp, durationMs2| filter path = "/api/orders"3| stats pct(durationMs, 95) as p95, count(*) as requests by bin(5m)A CloudWatch Logs Insights query you can add as a dashboard widget: p95 latency and request count every 5 minutes.
Save yourself the pain
Common mistakes
Oops
A dashboard with 40 panels that nobody can read during an outage.
Do this instead
Keep the main view to under ten panels. Move details to linked drill-down dashboards.
Oops
Only showing average latency.
Do this instead
Show p95 or p99 as well. A fine average can hide the 5% of users waiting seconds.
Your mission
Build a golden-signals board
Quick check
Why show p95 latency instead of just the average?
Go deeper
- 1Build a simple dashboard covering 5-6 key metrics for a resource you've deployed.
- 2Limit a first-draft dashboard to the most important signals before adding more.
- 3Practice designing a dashboard someone else could understand without you explaining it.
More topics at this stop
 Cloud-Native Monitoring (CloudWatch, Stackdriver, Azure Monitor)
 Logging Best Practices
 Metrics, Logs & Traces
 Alerting & Notification Systems
 SLIs, SLOs & Error Budgets
 Cost Monitoring & Anomaly Detection
 Distributed Tracing Basics

Stuck on this topic? Ask an Insider
Get 1:1 guidance from people who've walked this exact path — on the InsideEdge app.
