
Distributed Tracing (Jaeger, OpenTelemetry)
Part of the DevOps Roadmap
In short
A checkout request touches the gateway, cart, payment and inventory services. It took 3 seconds. Which one was slow? Distributed tracing draws that one request's path with a timer on every hop.
Tracking a single request as it flows through multiple microservices, capturing timing at each hop — essential for diagnosing latency issues in distributed systems where logs and metrics alone can't show the full picture.
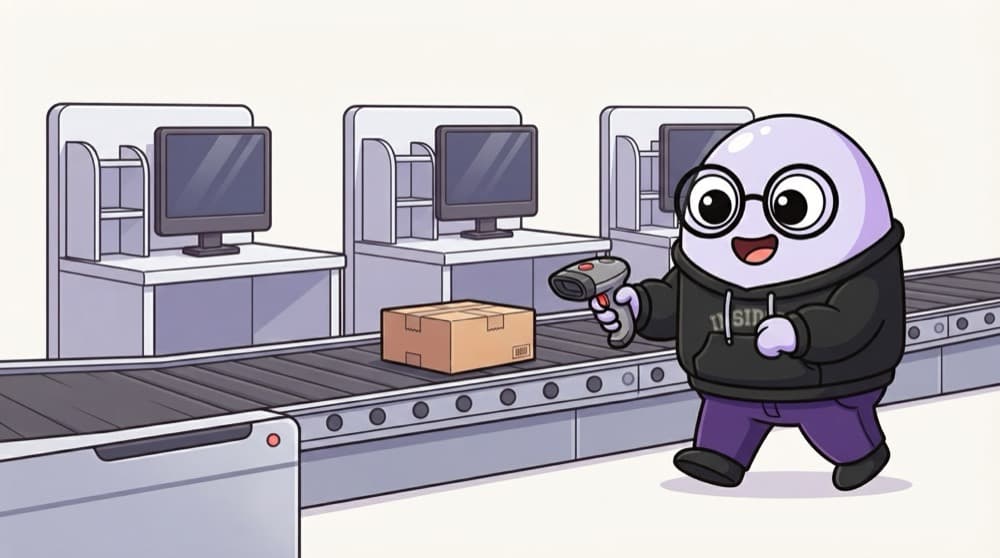
Think of it like this
Courier parcel tracking
Your parcel gets scanned at every hub: picked up, Delhi hub, Nagpur hub, out for delivery, each with a time. When it's late, the scans show exactly where it sat for two days. A trace is that tracking history, but for one web request across your services.
Watch it happen
One trace ID across three services
traceparent: 00-4bf9…
1/6The gateway starts a trace and passes its ID in the W3C traceparent header.
The big ideas
What you need to know
Trace and spans
A trace is one request. Each span is one unit of work inside it, with a start, an end and attributes.
Context propagation
The trace ID must travel with every call, usually in the traceparent header. One service that drops it breaks the chain.
OpenTelemetry is the standard
One set of open APIs and SDKs for traces, metrics and logs, which can send to Jaeger, Grafana Tempo or vendors.
Sampling
Busy systems keep only a share of traces. Make sure errors and slow requests are among the ones you keep.
See it in code
Walk through the code
1// tracing.js: load first with node --require ./tracing.js server.js2const { NodeSDK } = require("@opentelemetry/sdk-node");3const { getNodeAutoInstrumentations } = require("@opentelemetry/auto-instrumentations-node");4const { OTLPTraceExporter } = require("@opentelemetry/exporter-trace-otlp-http");5 6const sdk = new NodeSDK({7 serviceName: "checkout",8 traceExporter: new OTLPTraceExporter({ url: "http://localhost:4318/v1/traces" }),9 instrumentations: [getNodeAutoInstrumentations()],10});11sdk.start();1/4This file must load before your app code, so it can patch libraries like http and express.
Run Jaeger locally with the official jaegertracing image, publishing ports 16686 (UI) and 4318 (OTLP over HTTP), then open localhost:16686.
Save yourself the pain
Common mistakes
Oops
Instrumenting only one service and expecting a full picture.
Do this instead
Tracing pays off when every hop propagates context. Start with the gateway and the busiest services.
Oops
Keeping 100% of traces on a high-traffic system.
Do this instead
Sample. Head sampling keeps a fixed share; tail sampling in the collector can keep all errors and slow requests.
Your mission
See your first trace
Quick check
Spans from service B show up in Jaeger, but as separate traces from service A's spans. What's the likely cause?
Go deeper
- 1Read a conceptual explanation of how a trace ID propagates across service calls.
- 2Explore Jaeger's UI (via a demo or local setup) to see a sample distributed trace.
- 3Learn why OpenTelemetry has become the standard, vendor-neutral way to instrument applications for tracing.
More topics at this stop
 Monitoring vs Observability
 Metrics, Logs & Traces (The 3 Pillars)
 Prometheus Fundamentals
 Grafana Dashboards
 The ELK / EFK Stack
 Alerting Best Practices
 SLIs, SLOs & Error Budgets
 Incident Response Basics

Stuck on this topic? Ask an Insider
Get 1:1 guidance from people who've walked this exact path — on the InsideEdge app.
