
Metrics, Logs & Traces (The 3 Pillars)
Part of the DevOps Roadmap
In short
When something breaks, you'll ask three things: how bad is it, what exactly happened, and where did the time go? Metrics, logs and traces each answer one of those, and you need all three.
Metrics are numeric measurements over time, logs are discrete event records, and traces follow a single request across multiple services — together they give a complete picture of system behavior.
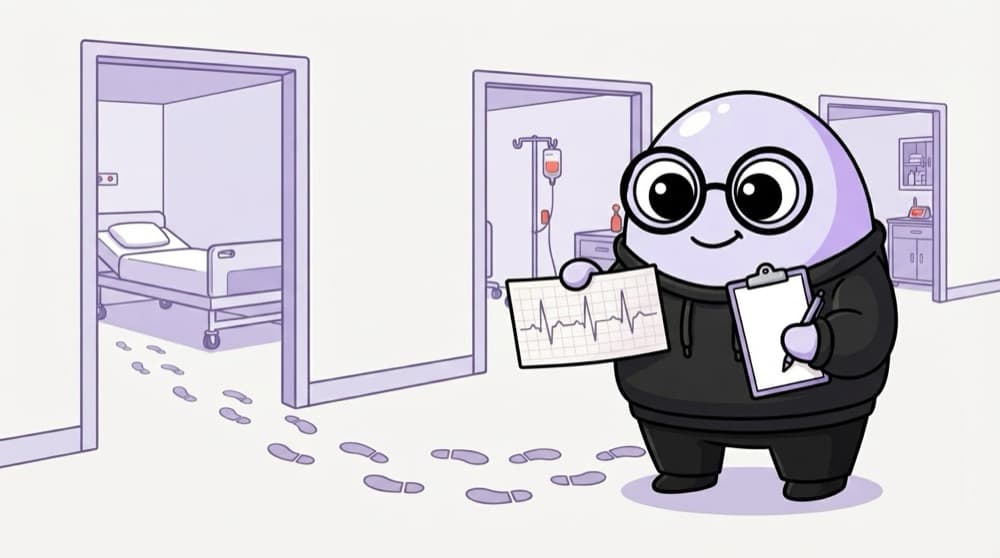
Think of it like this
A patient in hospital
The BP chart shows numbers over time. The nurse's notes record each event: 'fever at 2 am, gave medicine'. The patient's path shows each department visited and how long each took. Metrics are the chart, logs are the notes, traces are the path.
Watch it happen
One failed checkout, three signals
errors_total +1
1/5A counter goes up. Cheap to store, great for graphs and alerts, but no details about this one request.
The big ideas
What you need to know
Metrics: numbers over time
Counters, gauges and histograms. Cheap at scale, ideal for alerts and trends, light on detail.
Logs: events with detail
What happened, with context. Use structured JSON so you can search by field, not by regex.
Traces: one request's path
Spans show each hop and its timing across services. Best for 'where did the time go?'
Link them with IDs
Put the trace ID in every log line. Then you can jump between signals during an incident.
See it in code
Walk through the code
1{2 "time": "2026-10-27T10:42:13Z",3 "level": "error",4 "msg": "payment failed",5 "order_id": "ord_8812",6 "trace_id": "4bf92f3577b34da6a3ce929d0e0e4736",7 "duration_ms": 12408}1/3When, how serious, and a short fixed message you can search and group by.
A structured log line. Most logging libraries for Node.js, Python and Go can write JSON like this, and OpenTelemetry can add the trace ID for you.
Save yourself the pain
Common mistakes
Oops
Putting user IDs or order IDs as metric labels.
Do this instead
Each unique label value creates a new time series and can overload your metrics system. Put IDs in logs and traces.
Oops
Logging free-text sentences like 'oops it broke for user 7'.
Do this instead
Log structured fields with a fixed message, so you can filter by level, user or order in seconds.
Your mission
Instrument one endpoint
Quick check
You need to know which of five services made one request slow. Which signal answers that best?
Go deeper
- 1Identify a real debugging scenario and which pillar (metrics, logs, or traces) would help most.
- 2Learn why traces are especially critical in microservice architectures where one request touches many services.
- 3Understand these three pillars are complementary, not redundant with each other.
More topics at this stop
 Monitoring vs Observability
 Prometheus Fundamentals
 Grafana Dashboards
 The ELK / EFK Stack
 Distributed Tracing (Jaeger, OpenTelemetry)
 Alerting Best Practices
 SLIs, SLOs & Error Budgets
 Incident Response Basics

Stuck on this topic? Ask an Insider
Get 1:1 guidance from people who've walked this exact path — on the InsideEdge app.
