
Probability Distributions
Part of the AI Engineer Roadmap
In short
Heights, exam marks, clicks per ad, orders per minute: each follows a typical shape. Knowing the common distributions helps you spot weird data and pick the right model or loss.
Normal, Bernoulli, binomial and Poisson distributions describe how data and model outputs are shaped — essential for understanding model outputs and statistical tests.
Think of it like this
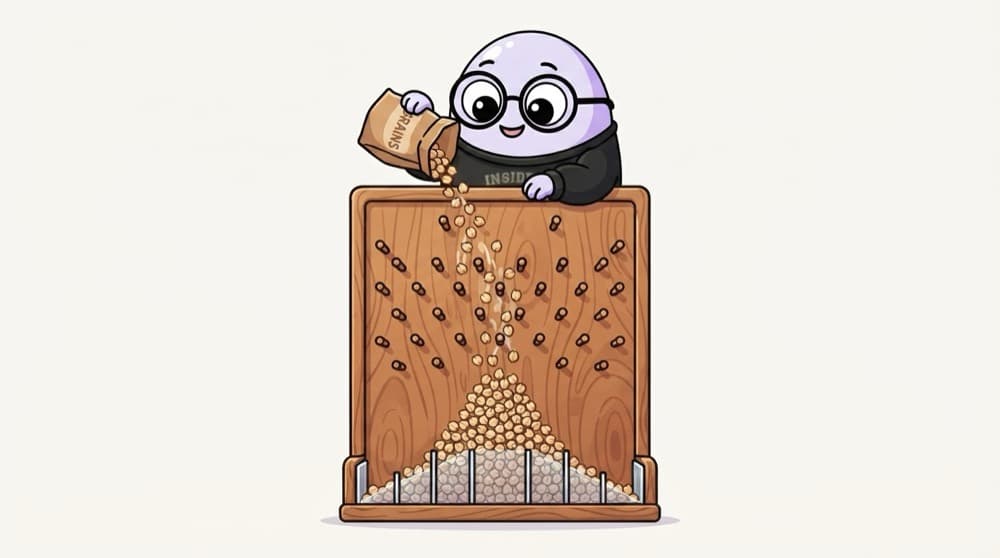
Chana through a pegboard
Pour chana from the top of a board full of pegs. Each one bounces left or right at random. Most land in the middle slots, fewer at the edges, and a bell-shaped pile forms. That pile's shape is a distribution: it shows how likely each outcome is.
Watch it happen
The common distributions
1/5Discrete outcomes are countable, like clicks. Continuous ones can be any value in a range, like height.
The big ideas
What you need to know
A distribution is a shape of chance
It tells you which values are common and which are rare. Mean and spread describe it in two numbers.
The 68-95 rule
For a normal distribution, about 68% of values fall within 1 standard deviation of the mean, and about 95% within 2.
Counts are not bell curves
Counts can't be negative and are often skewed. Poisson or binomial usually fits them better than normal.
Models output distributions
A classifier's softmax gives a probability for each class. Those numbers form a distribution that adds to 1.
See it in code
Walk through the code
1import numpy as np2rng = np.random.default_rng(0)3 4heights = rng.normal(loc=165, scale=7, size=10_000) # cm5print(heights.mean().round(1), heights.std().round(1)) # about 165.0 7.06print(np.mean(np.abs(heights - 165) < 14)) # about 0.957 8views = rng.binomial(n=1, p=0.03, size=10) # Bernoulli: clicked or not9clicks = rng.binomial(n=100, p=0.03, size=5) # clicks per 100 views10orders = rng.poisson(lam=4, size=5) # orders per minute11print(views, clicks, orders)1/310,000 heights from a normal with mean 165 and standard deviation 7.
default_rng is numpy's recommended random generator. Sampling from a distribution and checking its numbers is a quick way to build intuition.
Save yourself the pain
Common mistakes
Oops
Assuming every column is normally distributed.
Do this instead
Plot a histogram first. Incomes, waiting times and counts are often skewed.
Oops
Using a normal model for counts and getting negative predictions.
Do this instead
Use a distribution that fits counts, like Poisson, so predictions stay at zero or above.
Your mission
Draw the pegboard
Quick check
You want to model how many customers walk into a shop each minute. Which distribution fits best?
Go deeper
- 1Learn the shape and use case of the normal, Bernoulli, binomial and Poisson distributions.
- 2Plot each distribution in Python with different parameters to build intuition.
- 3Connect distributions to real ML use cases (e.g. logistic regression outputs a Bernoulli probability).
More topics at this stop
 Linear Algebra Basics (Vectors, Matrices)
 Matrix Operations
 Eigenvalues & Eigenvectors
 Calculus Basics (Derivatives, Gradients)
 Chain Rule
 Partial Derivatives
 Probability Fundamentals
 Bayes' Theorem
 Descriptive Statistics
 Hypothesis Testing
 Correlation vs Causation
 Optimization Basics (Gradient Descent)

Stuck on this topic? Ask an Insider
Get 1:1 guidance from people who've walked this exact path — on the InsideEdge app.
